
Understanding Earthquakes through Analyzing and Plotting Data
Preview/Download
Buy at Teachers Pay Teachers
In this Earth Science activity, students will gain a deeper understanding of the following Vocabulary: seismologist, seismograph, seismogram, epicenter, P-Wave, S-Wave, Wave Amplitude, Magnitude, and Richter/Moment Scale.
Students will create a digital spreadsheet that will help them calculate data they gathered by looking at actual seismograms. Technology is incorporated throughout the lesson.
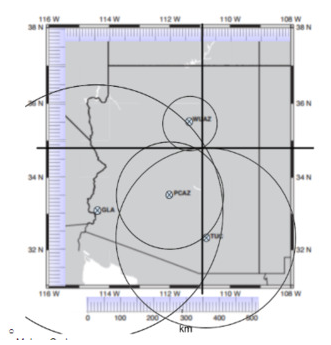
Students will determine the P and S wave arrival times and use that information to triangulate the location of an epicenter in Arizona. Students will use Google Earth or maps to see what is around the location of the epicenter. Students will determine and calculate different magnitudes. They will learn how to calculate the energy released by an earthquake and compare those calculations with different magnitudes. They will use a website that will help them get a better understanding of how much energy is actually released by earthquakes of different magnitudes and compare the power of different magnitudes to the power of sticks of dynamite. Students will do a small study on the 2011 Japan earthquake so that they can get an understanding of just how much power can be released by an earthquake.
When they are done, they will create a press release that a geologist just might write about the specific Arizona earthquake and present their findings to the class.
For more Earth Science labs and lessons visit, EarthScience.xyz