Understanding Plate Tectonics Lab
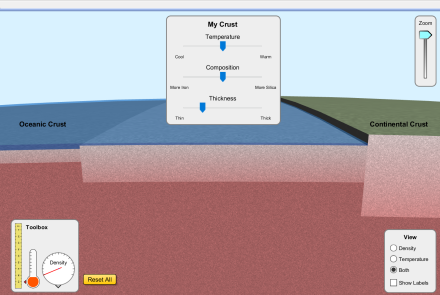
This lab will only work if you have Java on your computers. It should work fine on Windows machines.
This lab will only work if you have Java on your computers. It should work fine on Windows machines.
NOTE: Make sure your computers can run Java-based software. Inside the preview, you can test the program out by clicking on the first link. This program will not work with Chromebooks as they can't run Java.

Turn your students into meteorologists with this engaging, real-world weather activity!
Move beyond static textbook diagrams and get your students analyzing live data. This comprehensive lesson and lab helps students understand the complex relationships between air pressure, air masses, and weather fronts using current, real-time surface maps.
Perfect for 7th Grade through High School Earth Science, this resource combines literacy, theory, and digital investigation to ensure students master meteorology concepts.
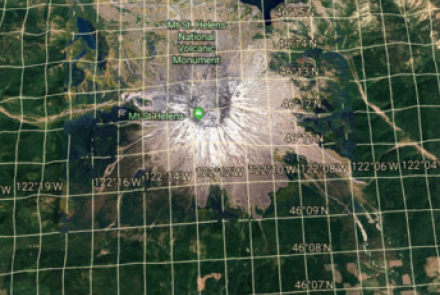
In this activity, students will use Google Earth to find the coordinates of some awesome Geologic Formations. Students will have a greater understanding of latitude and longitude. They will gain an understanding of how to use Google Earth to make discoveries. A link to a presentation that contains images and the geology behind many of the formations is also available. There are two parts to the assignment. First students will type in the coordinates into Google Earth to make a discovery.
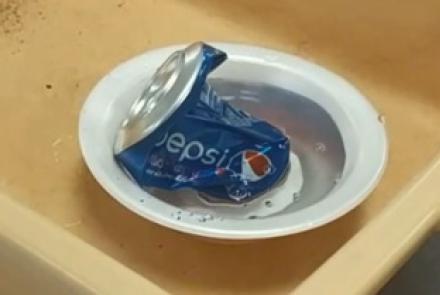
In this Earth Science lab, students will crush a soda can using atmospheric pressure. This is a common science experiment with a twist. In this version, students will calculate the total air pressure found on the outside of the can. The kids will take the surface area formula of a cylinder and find out about how many pounds of air is sitting on top of and around the can. This lab also attempts to incorporate math into a science class.
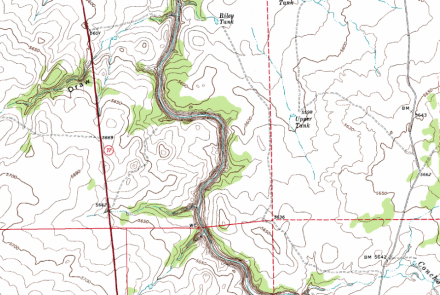
In this activity, students will engage in a topographic map exercise. When a student is finished they will understand what contour lines, elevation, contour interval, contour index, and quadrants are. Students will analyze a map of Snowflake AZ, you can pick your own map if you wish, and discover why it is important to understand topographic maps.
For more Earth Science Labs and Resources visit EarthScience.xyz

In this assignment, students will research 6 water features that are found in Yellowstone National Park. They will find three images and three facts about each feature. They will create a 7 slide presentation. Attached is a paper that contains a grading rubric and the student instructions for this assignment. Water features researched are Hot springs, travertine terraces, mud pots, geysers, fumaroles, and thermophiles.
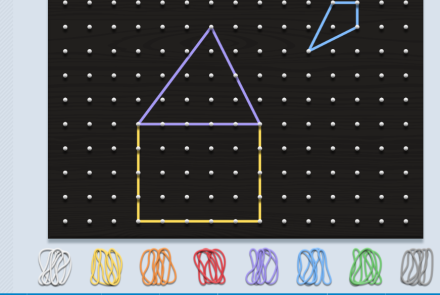
I use this digital geoboard with my 3rd grade students when teaching shapes. I have students do their best to create, 2d shapes like triangles, right triangles, pentagon, hexagon, octogon, kite, square, rhombus, and rectangles. When we are done with learning the shapes, students create their own image on the geoboard. There are many variables that students and teachers can use when creating their shapes like, rubber band color, size of geoboard, add grid, fill in each shape to count area and perimeter, and add text. Once finished you cna click the share button to gen
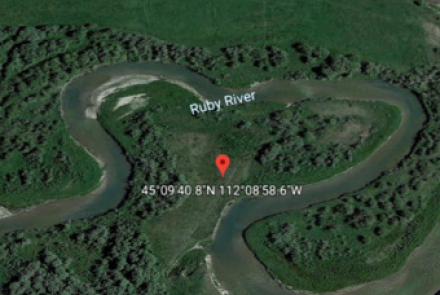
In this Earth Science digital activity, students will locate specific water eroded or deposited landforms. The activity will enhance their understanding of Geo Coordinates. Students will use Google Earth and become more proficient with its use. Students will see actual satellite views of their vocabulary words instead of just memorizing the definitions. Vocabulary words that will be reinforced are Meanders, oxbow lakes, sediment, river types (old, mature, young), delta, deposition, erosion, alluvial fan, and flood plain.
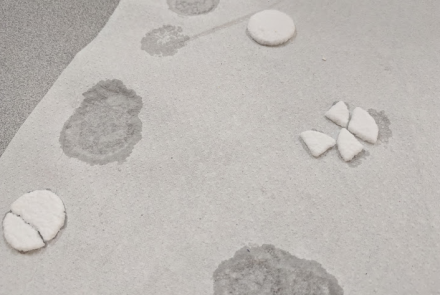
In this Earth Science lab, students will design an experiment to answer the following question. Will rock weather faster or slower if it has more surface area exposed? Students will use Alka-Seltzer as their rocks. They will have to come up with a control and two other variables, They will need to list their hypothesis, step by step procedures, observations, and create a statement of conclusion. When they are finished they will understand the relationship between surface area and rate of weathering.