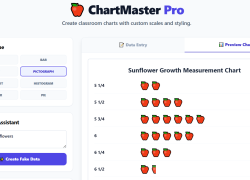
Easily create custom classroom charts. Students will analyze data, interpret graphs, and develop essential graphing skills across subjects like math, science, and social studies.
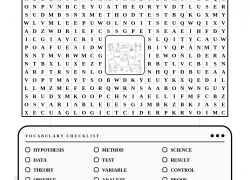
Students will master essential scientific method vocabulary, including Hypothesis and Experiment, using engaging digital and printable activities. They'll build scientific literacy and critical visual skills.
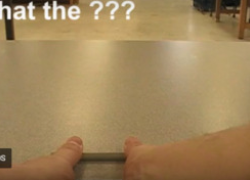
Engage students measuring metric distances by propelling pens across the room. They will discover the Magnus Effect and learn to analyze data using spreadsheets with formulas.
Students engage with the scientific method, honing grammar skills. They practice writing complete sentences to document experiment observations and insightful conclusions effectively.
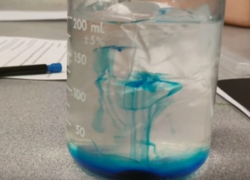
Equip students to master the scientific method through a hands-on experiment. They will practice data collection, identify variables, and formulate clear conclusions.