Unlock Premium Teacher Access
🔓 Unlock Premium Teacher Access
Everything you need. One simple yearly plan.
Upgrade to Premium and get full access to all current and future content—designed to save you time, boost engagement, and support real classrooms.
✅ What’s included with Premium
-
Unlimited access to all content on the site
-
Exclusive teacher tools to plan, practice, and assess faster
-
Future Teachers Pay Teachers resources included
(All my current and upcoming TPT products will be added at no extra cost) -
New content added regularly—your subscription grows in value over time
💲 Simple, affordable pricing
$20 per year
Less than $2 a month for tools you can use all year long.
🎯 Who Premium is for
-
Classroom teachers who want ready-to-use resources
-
Teachers who like games, tools, and engagement
-
Anyone tired of buying the same types of resources over and over
Upgrade to Premium
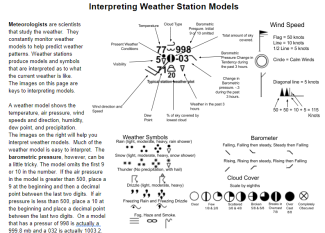
In this self-guided activity, students will gain an understanding of how to interpret basic to advanced weather station models. They will read barometric pressure examples and interpret whether the barometer is rising or dropping. Students will learn what many of the symbols on station models represent. Students will take real station model data from 2017 from around the country. They will have to interpret the temperature, dew point, wind speed in knots, wind direction, millibar pressure, change in MB, sky cover, visibility, and precipitation. After understanding the model symbols, students will then create their own station models based on other real data from the same year. The last thing students will do is analyze stations found on an actual weather map and interpret isotherms found on a 30,000 ft wind speed map.
When students are done with this self-guided activity, they will understand isotherms, millibars, and wind direction, and be exposed to warm and cold fronts and how that affects wind speed.