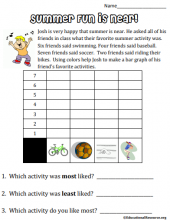
This is a two-page document. The first page tells a short story and students will graph the numbers in the story.
Graphing and Data
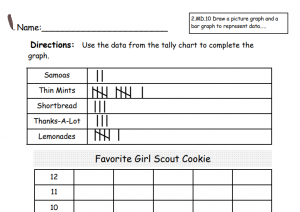
Students will demonstrate their current understanding of how to read tally marks and analyze data based on such information.
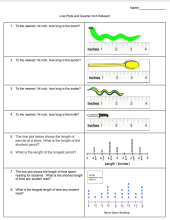
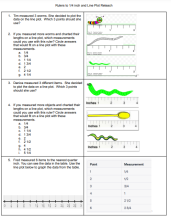
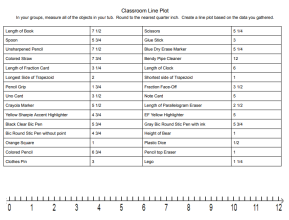
Students will practice measuring objects to the nearest quarter inch. They will also analyze line plots. This is designed to reteach the concept
This is a worksheet and practice in collecting data and representing it in bar graph form, and is designed to help students understand the fascinat
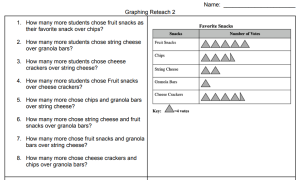
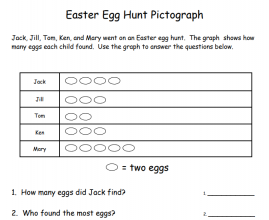
Students will answer 20 questions based on bar graphs or pictographs. The last three questions have the students create a pictograph based on a ba
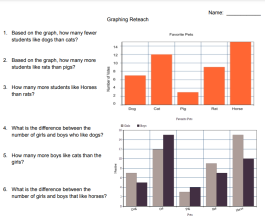
Students will answer 12 questions based on bar graphs and pictographs. Key phrases used are, how fewer, how many more, and what is the difference.
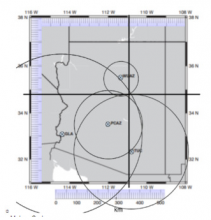
In this Earth Science activity, students will gain a deeper understanding of the following Vocabulary: seismologist, seismograph, seismogram, epice
Students will practice measuring objects with quarter-inch measurements. They will also practice creating line plots based on measurements and tab
Students will measure common objects to the nearest inch and then input them in a table. Or you can just use the table with common objects. Once
This is a method for your students to demonstrate their knowledge and understanding about reading and interpreting pictographs.

