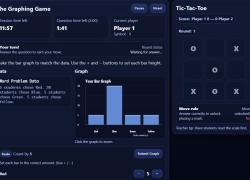
Boost 3rd graders' math skills! Students will practice money, time, rounding, data, and shapes through an exciting Jeopardy-style game. They'll solve problems and collaborate, reinforcing essential Quarter 3 concepts.

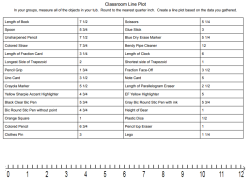
Students will measure objects to the quarter inch, record data, and create accurate line plots. They will analyze real-world scenarios to strengthen their 3rd-grade measurement and data analysis skills.
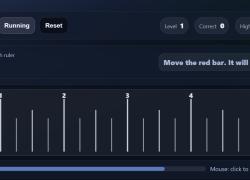
Students master reading inches and fractions on a ruler (1/2 to 1/16 inch). They interactively measure by moving a bar, practicing through engaging, progressive rounds.
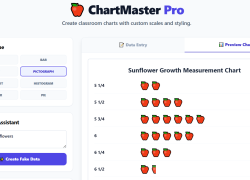
Easily create custom classroom charts. Students will analyze data, interpret graphs, and develop essential graphing skills across subjects like math, science, and social studies.
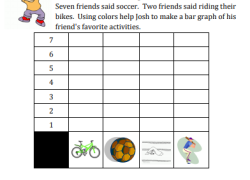
Help students master 3rd-grade graphing and data interpretation. They'll create bar graphs, read tally marks, and analyze data while playing an engaging game.
Students practice graphing numbers and interpreting data from a story. They also survey peers, create bar graphs, and analyze data on summer fun.
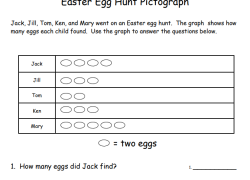
Help students master bar graphs and pictographs. They will answer 20 questions and practice creating pictographs from given data, reinforcing their understanding.
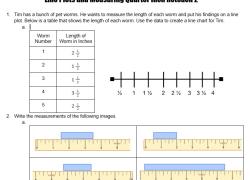
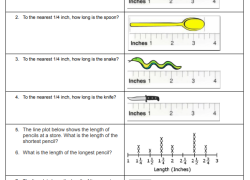
Students measure common objects to collect data, then construct and interpret line plots using a number line divided into quarters. They will answer related data questions.
Students will practice measuring to the nearest quarter inch and analyzing line plots. This targeted activity is perfect for reteaching and strengthening measurement concepts for struggling students.
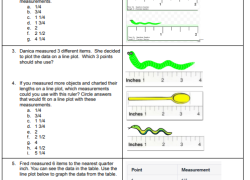
Students will practice quarter-inch measurements by measuring objects. They will also strengthen their understanding by creating accurate line plots from measurements and given tables.
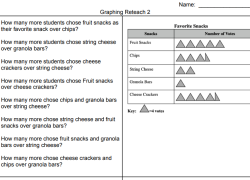
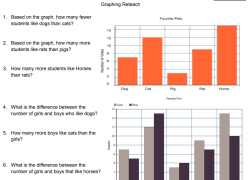
Students will practice interpreting bar graphs and pictographs by answering 12 questions. They focus on finding "how many more," "how fewer," and "difference.
Engage students with an Easter-themed activity where they read and interpret a pictograph. They will answer six questions, showcasing their data analysis and comprehension skills effectively.