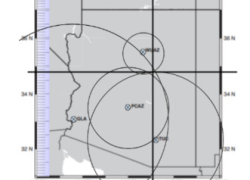
Students analyze seismogram data to triangulate earthquake epicenters. They calculate magnitudes, compare energy released, and understand seismic power, creating a professional press release.
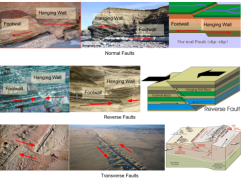
Students will use Google Drawing to create diagrams of earthquake fault types. They will identify real-world examples, apply forces like shear and tension, and label key geological structures.
Your students will observe a powerful earthquake and explore liquefaction, learning how ground turns to quicksand. They'll comprehend environmental impacts and structural shifts.