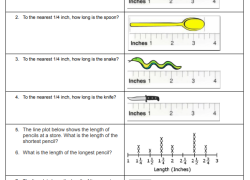
Students will measure objects to the quarter inch, record data, and create accurate line plots. They will analyze real-world scenarios to strengthen their 3rd-grade measurement and data analysis skills.
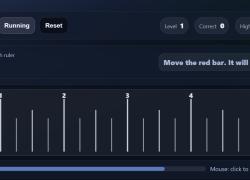
Students master reading inches and fractions on a ruler (1/2 to 1/16 inch). They interactively measure by moving a bar, practicing through engaging, progressive rounds.
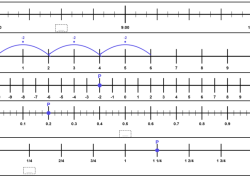
Students will explore integers, fractions, decimals, and elapsed time using custom number lines. They will visually master number sense and operations across various math topics.
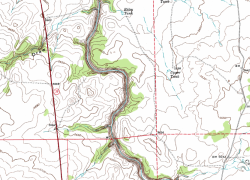
Students explore topographic maps in a lab, learning contour lines, elevation, and quadrants. They analyze maps, discovering their real-world importance in Earth Science.
Engage students measuring metric distances by propelling pens across the room. They will discover the Magnus Effect and learn to analyze data using spreadsheets with formulas.
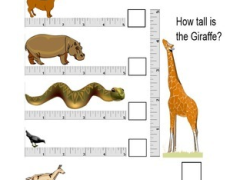
Students determine the dimensions of various animals, including length and height. They will compare sizes and practice related spelling, developing foundational math and literacy abilities.
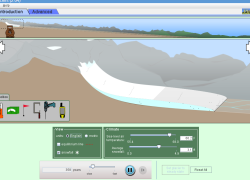
Students explore glacial formation, growth, and shrinkage. They act as scientists in an interactive lab, discovering how glaciers move and impact Earth's landscapes over time.
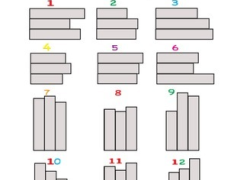
Engage students in comparing three rectangles to determine their lengths. They will mark the longest with a 1 and the shortest with a 2, building comparison skills.
Students will join Burt and Ernie to explore heavy and light through an engaging game video. Young learners will build foundational understanding of comparative weight and measurement skills.
Students will learn to identify and compare standard liquid volume units including cups, pints, quarts, and gallons. Use this video to build foundational understanding of capacity measurements.
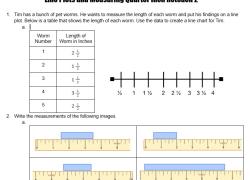
Students measure common objects to collect data, then construct and interpret line plots using a number line divided into quarters. They will answer related data questions.
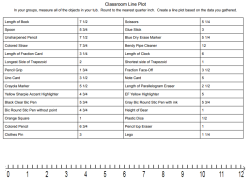
Students will practice measuring to the nearest quarter inch and analyzing line plots. This targeted activity is perfect for reteaching and strengthening measurement concepts for struggling students.