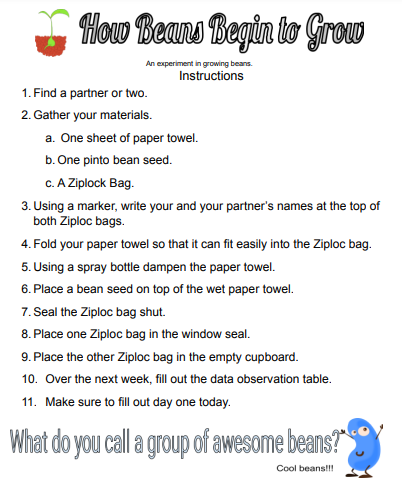
A Reading Experiment in Growing Beans

Image

An experiment in growing a pinto bean

This science reading product was created to teach my students the importance of reading instructions, reading technical instructions, and of course bringing awesome science into the reading curriculum.

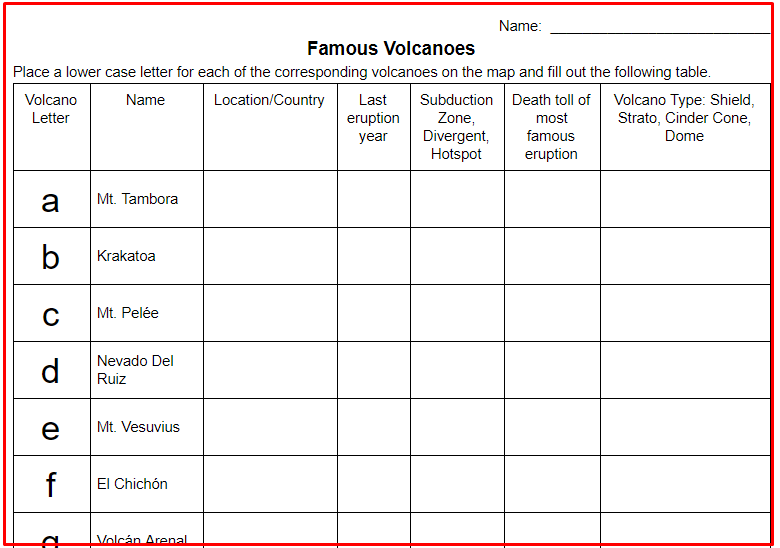
Students will follow instructions on how to grow a pinto bean. They will keep track of its growth for 6 days, filling out a Data Observation Table by sketching the changes and writing down some of the observations that they see going on. I have my students write the observations in complete sentences.

This is a Google doc so you can change instructions as you see fit.

Mapping Useful Ores Research Activity

Image

Mapping useful ores on world map image

In this assignment, students will open up a Google Doc, you can have it printed as well, and fill out a table of some very useful industrial ores. The ores that will be researched are diamonds, gold, rock salt, bauxite, iron, and titanium. Students will research which 3 countries in the world are the top producers of each ore. They will then find and write 2 or more industrial uses for each ore. As they are doing their research, students will also use a map and mark where these countries are. This is great to reinforce the geography standards.

Compare and Contrast: Which Animal is Cooler

Image

compare and contrast animals activity image

In this compare and contrast activity, students will read two articles or two books, or watch two short Youtube videos about two animals.  Students will then compare and contrast the two animals, finding differences and similarities.  This is a great assignment to bring science and biology into the reading classroom.

I use either Youtube videos or short books found on GetEpic. (GetEpic is a free reading program with thousands of free, fully colored books.)

Earth Science: Mapping Useful Ores Research Activity

Image

Earth Science: Mapping Useful Ores Research Activity

In this assignment, students will open up a Google Doc, you can have it printed as well, and fill out a table of some very useful industrial ores. The ores that will be researched are diamonds, gold, rock salt, bauxite, iron, and titanium. Students will research which 3 countries in the world are the top producers of each ore. They will then find and write 2 or more industrial uses for each ore. As they are doing their research, students will also use a map and mark where these countries are. This is great to reinforce the geography standards.

Earth Science: What's in that Mineral? Activity

Image

Earth Science: What's in that Mineral? Activity periodic table

This Google search activity allows students to go to the internet to search for specific minerals and then to use the Periodic Table to discover what elements the mineral is made out of. This activity usually takes a full 50 minutes for the students to find all of the answers. Students will investigate 12 different minerals and which elements make the mineral up. They will look at a periodic table and decide whether the elements are metals or nonmetals. Students will also search the internet and find out some industrial uses for each mineral.

Famous Volcanoes

Image

Famous Volcanoes Activity image

In this web research activity, students will research 14 volcanoes via the internet. All of these volcanoes are famous for either their size of eruption or the continuous eruptions that they have. They are famous for causing large tsunamis, huge pyroclastic flows, and lahars, as well as some that might not be so dangerous but have flowed continuously for many years. Students will enhance their geography knowledge by plotting the volcano's location on a plate tectonic map. They will find out when the last eruption occurred.

Google Drawing and Diagram: Fault Types and Forces

Image

Google Drawing and Diagram: Fault Types and Forces image

In this EdTech Earth Science activity, students will use Google Drawing to create an image that demonstrates the three main types of earthquake faults, Transverse, Normal, and Reverse. They will find 2 real images of each type of fault. They will draw arrows pointing in the direction that the forces, shear, compression, and tension are moving on each image. They will also find and add an actual diagram of each type of fault. Finally, students will label the hanging wall and footwall on each image except for the transverse/strike-slip.