Current USGS Significant Worldwide Earthquake Investigation

Image
worldwide earthquake map activity image

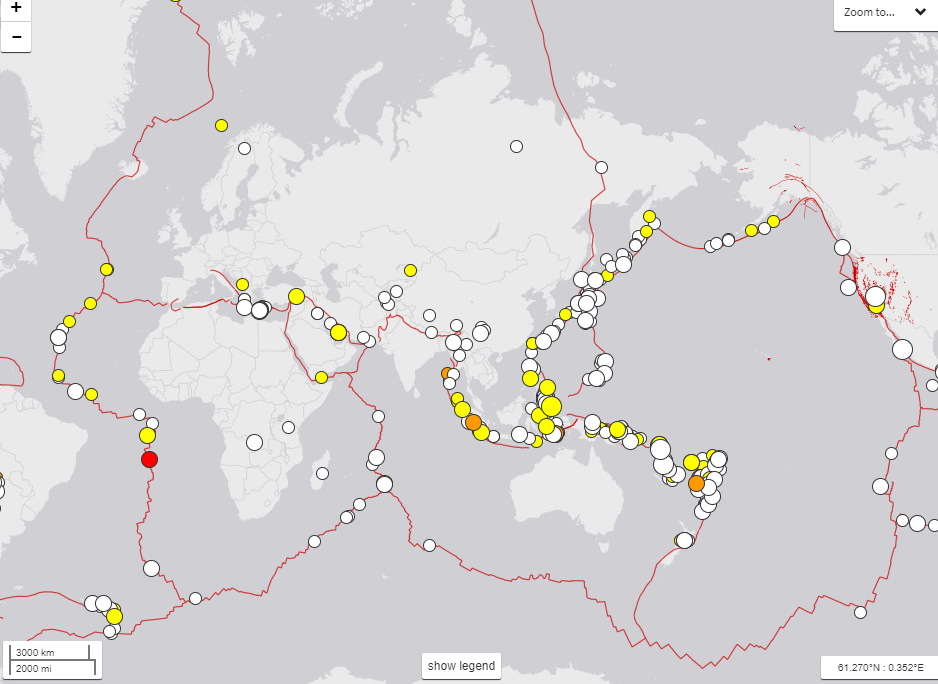
In this Earth Science Earthquake activity, students will explore the USGS current earthquake website. Students will understand what is to be found on the USGS Earthquake website. They will discover how many earthquakes have occurred recently. Students will gain an understanding of what the Mercalli Intensity Scale is used for. Students will discover the 5 largest recent earthquakes that have occurred around the world. They will gain a better understanding of geography as well by using maps and map scales to determine distances from an earthquake epicenter.

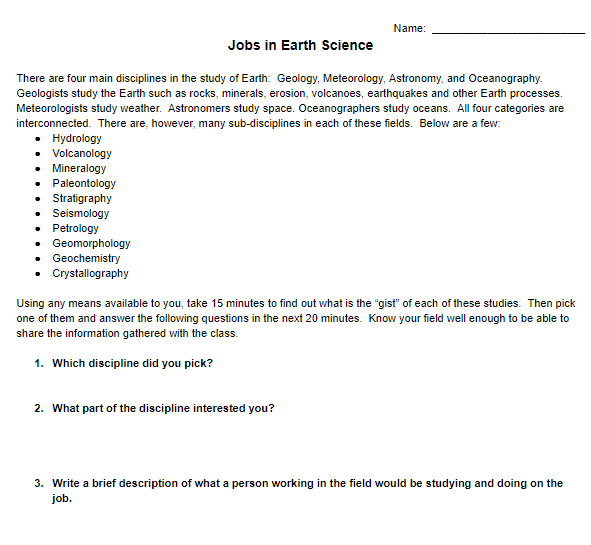
Jobs in Earth Science Investigation

Image

Jobs in Earth Science Investigation image

In this activity, students will briefly examine 10 fields/disciplines of Geology: hydrology, volcanology, mineralogy, paleontology, stratigraphy, seismology, petrology, geomorphology, geochemistry, and crystallography. They will pick one of those disciplines that they find interesting and find a job description in that field. Students will also find a salary range and what type of education they would need in order to obtain that salary. When students are finished, they should have an idea that there are money and great careers as a scientist in the field of Geology.

The Magnus Effect: A practice in using a meter tape

Image

measuring using meters

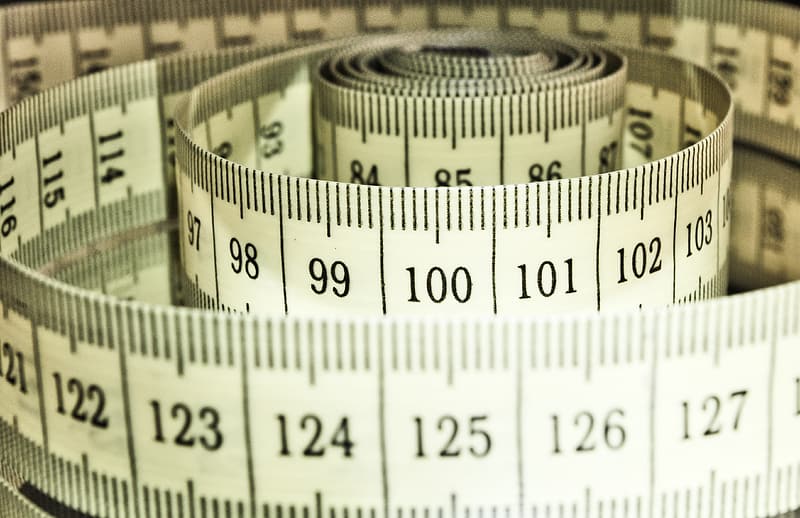
This science lab can be used in any of the science disciplines because it is going to help students learn how to read a meter tape. Students will learn what the Magnus Effect is and how to demonstrate the Magnus Effect by "flying" a hollowed-out "Bic" pen across the classroom. Students will also learn how to create a spreadsheet and then add a formula that will automatically calculate the average of their pen flight distances. I use this lab at the beginning of the year to get students excited about science as well.

Modeling Air Convection Currents

Image

air convection model

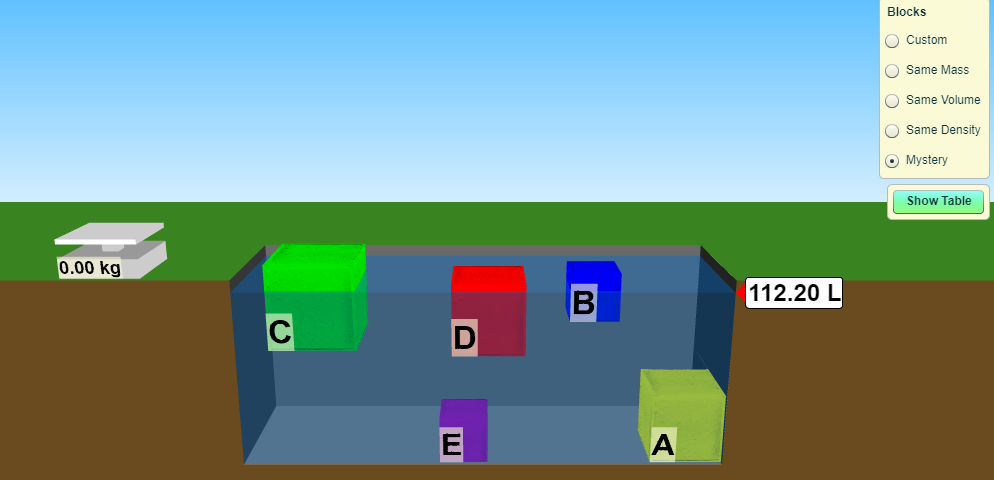
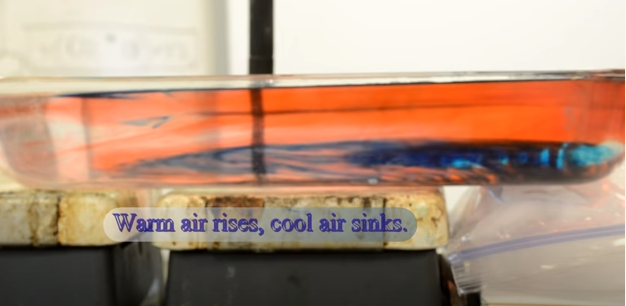
In this lab/demonstration, the teacher will demonstrate how convection currents in the atmosphere occur. This demonstration is very visible and can easily be done without any special equipment except for a hot plate. Students will fill out a science lab sheet that has them hypothesize and then diagram how air currents are moving. As part of the lab, students will get some reinforcement as to what high and low air pressures are and what causes them. Students will also be able to demonstrate their previously gained knowledge of density.

Relative Humidity and Dew Point Lab

Image

Relative Humidity and Dew Point Lab image

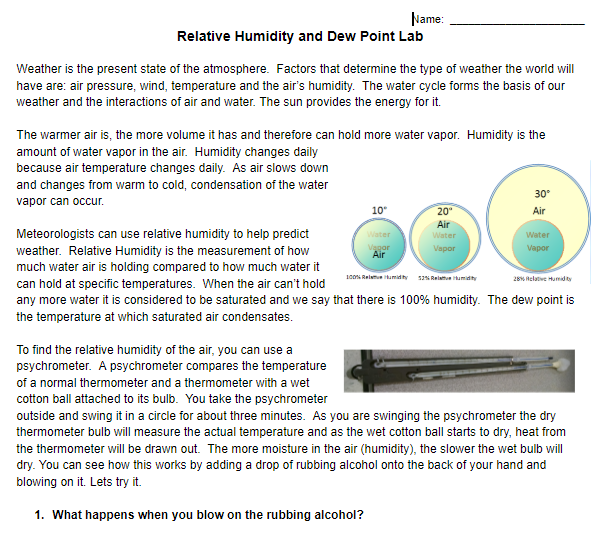
In this Earth Science Lab, students will gain an understanding of what relative humidity and dew point are. There are four parts to the lab. The first part will help them understand the relationship between the ability to evaporate and humidity. Students will then use psychrometers to determine the humidity outside as well as inside. They will calculate the wet-bulb depression and then use the relative humidity chart to determine the percent of water in the air outside and inside the classroom.

Identifying Cloud Types Weather Digital Activity

Image

Identifying Cloud Types Weather Digital Activity image

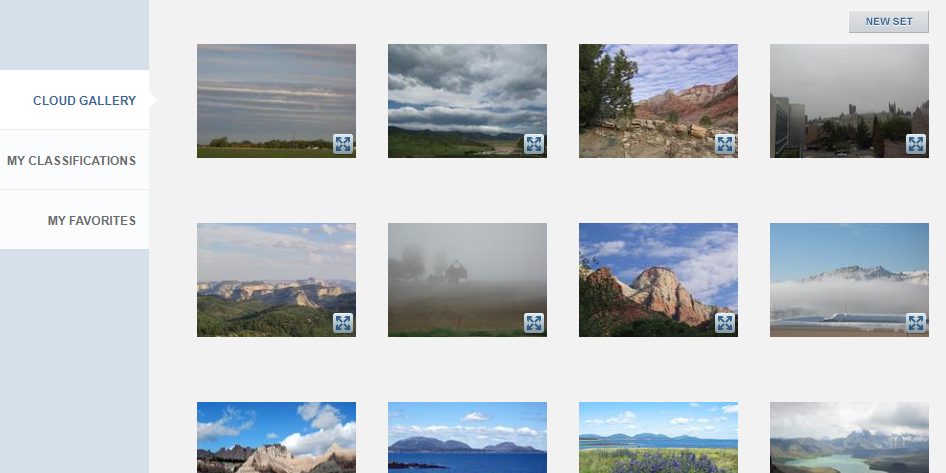
Engage in a captivating Earth Science activity that hones your cloud identification skills. In this interactive session, students will have the opportunity to discern various cloud types by analyzing 10 captivating cloud images, encompassing a minimum of 5 distinct cloud formations. This engaging exercise includes comprehensive teacher guidance and reflective discussions, allowing students to evolve into accomplished "Professional Cloud Identifiers" upon completing this enlightening weather laboratory.

Earth Science Absolute Dating Lab

Image

absolute dating lab image

In this earth science lab, students will flip M&Ms/Skittles to help them gain a better understanding as to what absolute dating is. Students will learn what radioactive elements are and how scientists use this understanding to give an age to rocks and fossils. Students will create a spreadsheet and create a graph that will visually demonstrate the half-life of Carbon 14. There are 6 word problems that they will analyze to help them understand how to use a half-life graph.

Earth Science Google Drawing Concept Map

Image

concept map example earth science google drawing

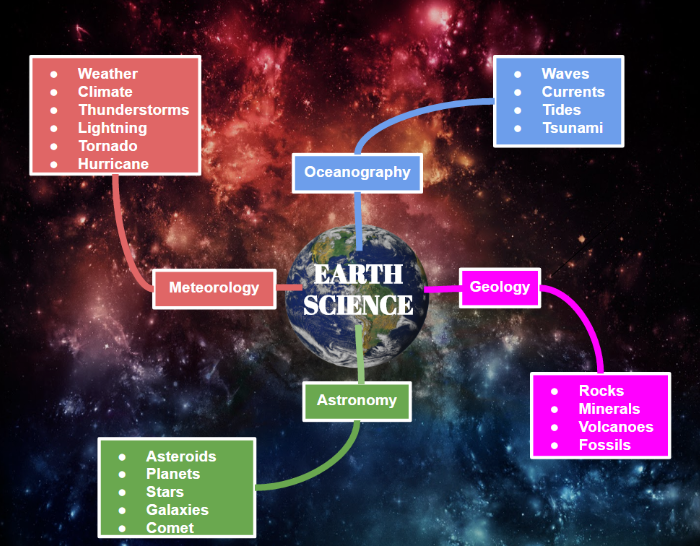
In this Google Drawing activity, students will create a concept map using the following words: Earth Science, geology, waves, currents, astronomy, oceanography, stars, volcanoes, planets, meteorology, fossils, weather, climate, rocks galaxies, thunderstorms, tides, tsunamis, lightning, comets, minerals, asteroids, tornadoes, hurricanes, and earthquakes.