Identifying Cloud Types Weather Digital Activity

Image
Identifying Cloud Types Weather Digital Activity image

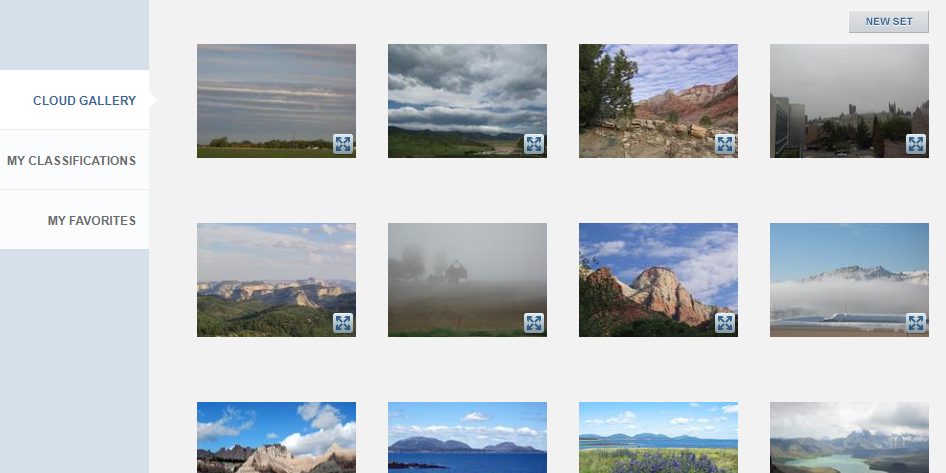
Engage in a captivating Earth Science activity that hones your cloud identification skills. In this interactive session, students will have the opportunity to discern various cloud types by analyzing 10 captivating cloud images, encompassing a minimum of 5 distinct cloud formations. This engaging exercise includes comprehensive teacher guidance and reflective discussions, allowing students to evolve into accomplished "Professional Cloud Identifiers" upon completing this enlightening weather laboratory.

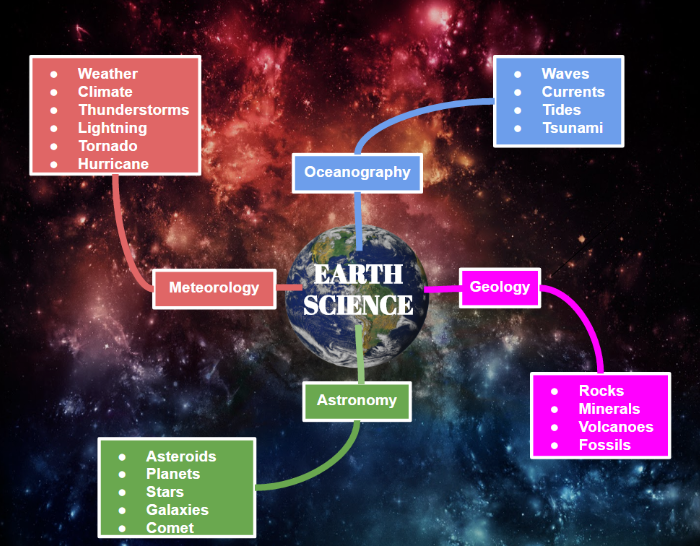
Earth Science Google Drawing Concept Map

Image

concept map example earth science google drawing

In this Google Drawing activity, students will create a concept map using the following words: Earth Science, geology, waves, currents, astronomy, oceanography, stars, volcanoes, planets, meteorology, fossils, weather, climate, rocks galaxies, thunderstorms, tides, tsunamis, lightning, comets, minerals, asteroids, tornadoes, hurricanes, and earthquakes.

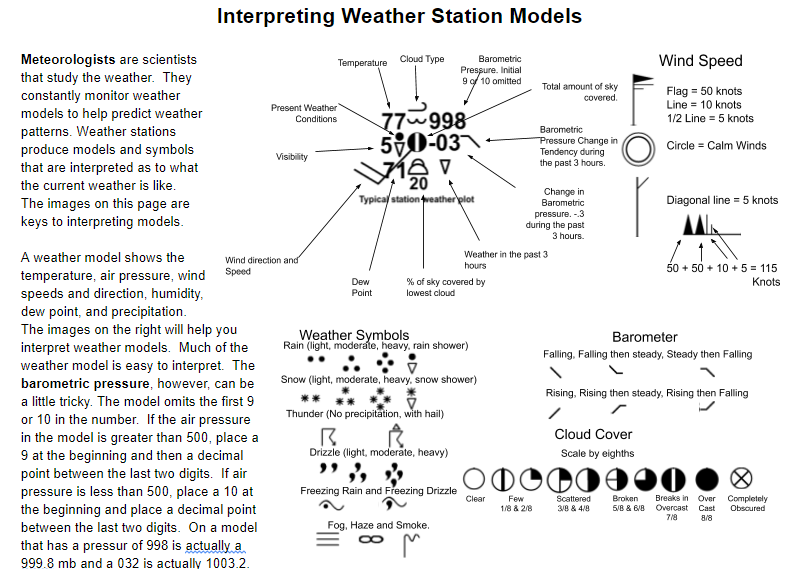
Understanding how to Interpret Weather Station Models

Image

Weather Station Models Image

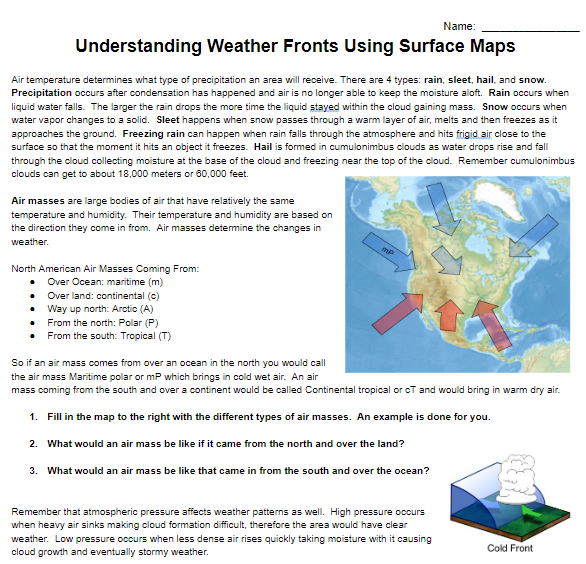
In this self-guided activity, students will gain an understanding of how to interpret basic to advanced weather station models. They will read barometric pressure examples and interpret whether the barometer is rising or dropping. Students will learn what many of the symbols on station models represent. Students will take real station model data from 2017 from around the country. They will have to interpret the temperature, dew point, wind speed in knots, wind direction, millibar pressure, change in MB, sky cover, visibility, and precipitation.

Composition of the Atmosphere Lab for Earth Science

Image

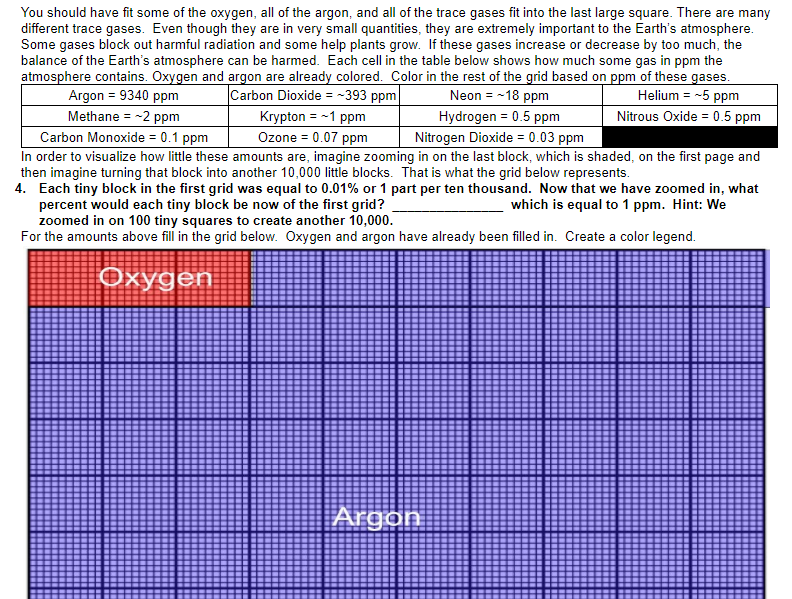
Composition of the Atmosphere Lab

In this Earth Science activity, students will gain a better understanding of what gases the atmosphere is made out of. Students will need to work some math problems out, converting percents and decimal places to determine ppm, parts per million. Students will gain an understanding that greenhouse gases make up such a small amount of the atmosphere, but are extremely important in keeping the temperature balance in check.

Earth Science Tornado Statistics Project

Image

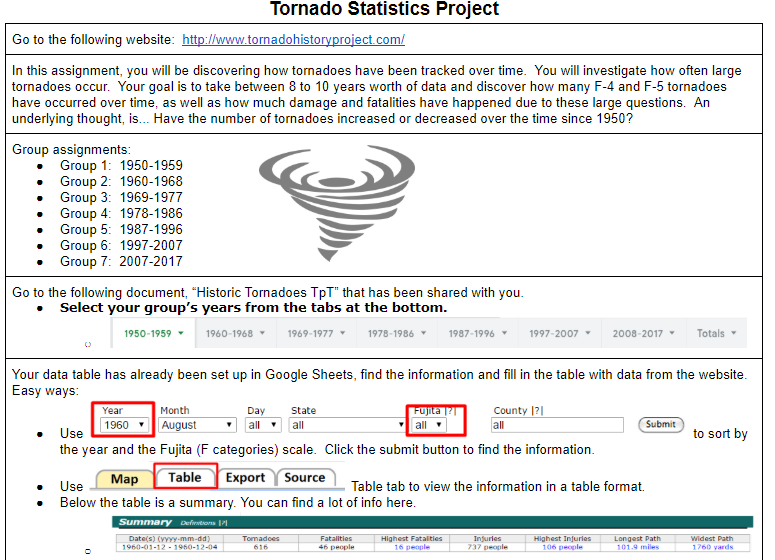
Tornado Earth Science Lab Digital image

 In this assignment, students will access a database with documented tornadoes since 1950. Students will use a Google spreadsheet as a class to gather data from the website. Data they will look into for each year are: Total tornadoes, Longest path, widest path, total F4s, total F4 fatalities, total F5s, total F5 fatalities, the month with the most tornadoes, and deadliest tornado sizes. When all data is collected there is a totals tab that contains three graphs that students can analyze. Students will also investigate and view states that have the most tornado events.

Using Atmospheric Pressure to Crush a Can Lab Sheet

Image

Atmospheric Pressure Crush Can

In this Earth Science lab, students will crush a soda can using atmospheric pressure. This is a common science experiment with a twist. In this version, students will calculate the total air pressure found on the outside of the can. The kids will take the surface area formula of a cylinder and find out about how many pounds of air is sitting on top of and around the can. This lab also attempts to incorporate math into a science class.

Understanding How a Barometer Works with High and Low Pressure Systems

Image

DIY Barrometers

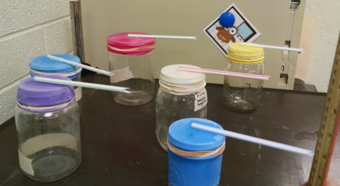
In this Earth Science lab, students will create their own homemade barometers using a canning jar, a balloon, and a straw. The barometers can show low and high-pressure systems. After they build their barometers, students will complete a daily log, by measuring the height differences of their barometers. They will determine rising and falling barometers. Students will also observe the weather that is currently outside.