
Understanding how to Interpret Weather Station Models
Preview/Download
Buy at Teachers Pay Teachers
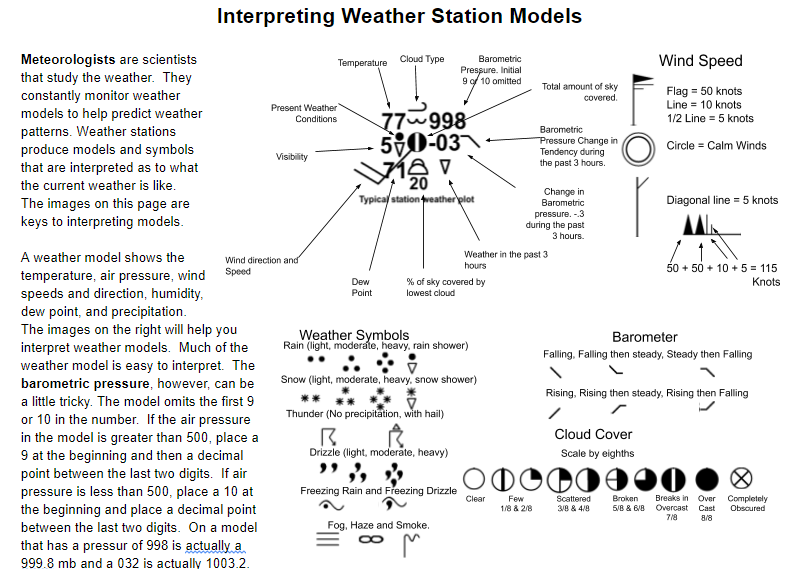
In this self-guided activity, students will gain an understanding of how to interpret basic to advanced weather station models. They will read barometric pressure examples and interpret whether the barometer is rising or dropping. Students will learn what many of the symbols on station models represent. Students will take real station model data from 2017 from around the country. They will have to interpret the temperature, dew point, wind speed in knots, wind direction, millibar pressure, change in MB, sky cover, visibility, and precipitation. After understanding the model symbols, students will then create their own station models base on other real data from the same year. The last thing students will do is analyze stations found on an actual weather map and interpret isotherms found on a 30,000 ft wind speed map.
When students are done with this self-guided activity, they will understand isotherms, millibars, wind direction, and be exposed to warm and cold fronts and how that affects wind speed.
Find more Earth Science activities and experiment ideas, visit: http://EarthScience.xyz .