Using Atmospheric Pressure to Crush a Can Lab Sheet
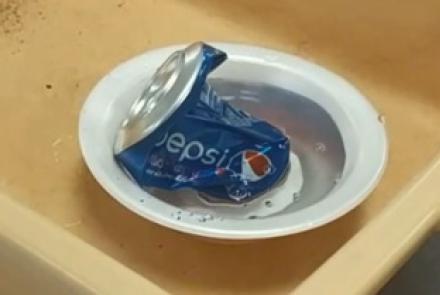
In this Earth Science lab, students will crush a soda can using atmospheric pressure. This is a common science experiment with a twist. In this version, students will calculate the total air pressure found on the outside of the can. The kids will take the surface area formula of a cylinder and find out about how many pounds of air is sitting on top of and around the can. This lab also attempts to incorporate math into a science class.