Order Numbers Least to Greatest 1-20
Image
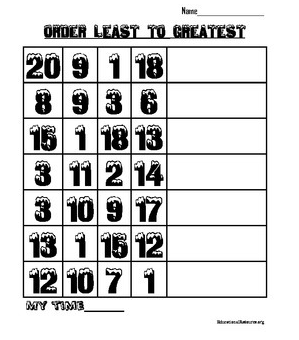
In this worksheet students will order 7 sets of 4 numbers from least to greatest; numbers 1-20. There is space for adding a student's time if you want to turn this into a speed fluency check.

In this worksheet students will order 7 sets of 4 numbers from least to greatest; numbers 1-20. There is space for adding a student's time if you want to turn this into a speed fluency check.
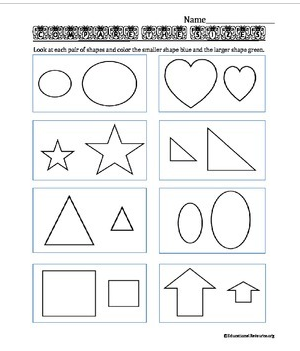
Students will compare the size of each pair of shapes. They will color each shape according to the comparison.
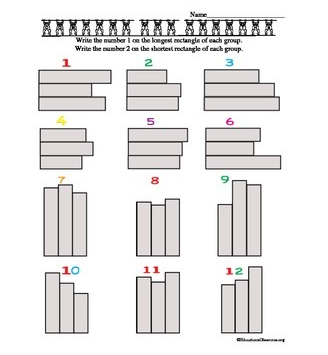
Students will compare the lengths of three rectangles. They will write the number 1 in the rectangle that is the longest and the number 2 in the rectangle that is the shortest.
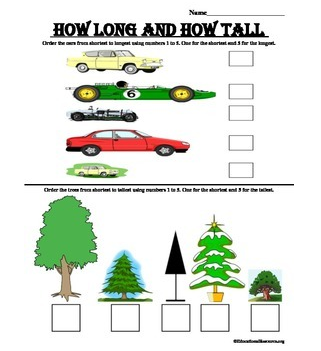
This worksheet has students comparing the length of 5 cars and the height of 5 trees. They need to decide the order from the shortest to the tallest and shortest to longest.
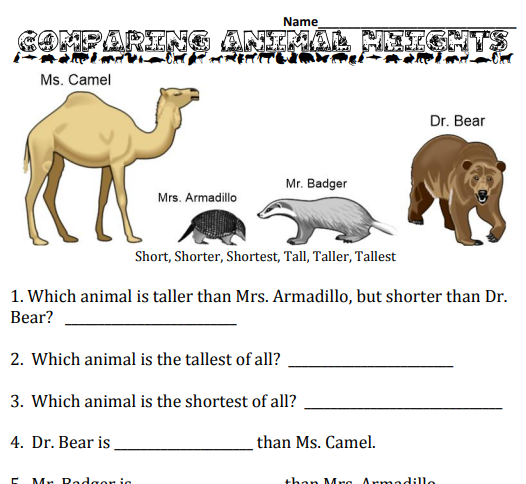
In this worksheet, students will read, understand and use the words, short, shorter, shortest, tall, taller, and tallest to compare the heights of 4 different animals.
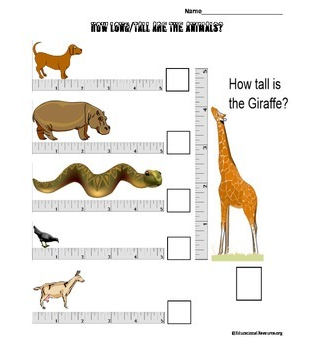
Students will measure the length of a bird, snake, dog, hippo, and a goat. They will also measure the height of a giraffe. This worksheet includes a comparing activity and some practice with spelling.
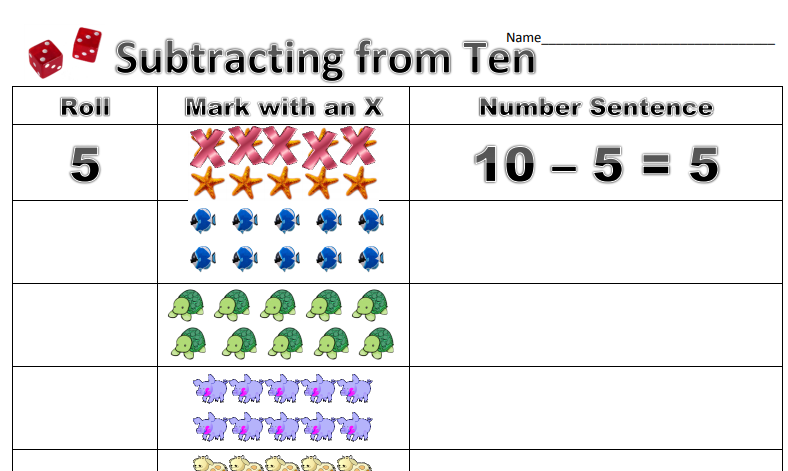
Students will first roll a number cube. This number will then let students know how many of the 10 animals need to be eliminated/subtracted. They will cross that many off. They will then create a number sentence to mathematically explain how they end up with fewer animals.
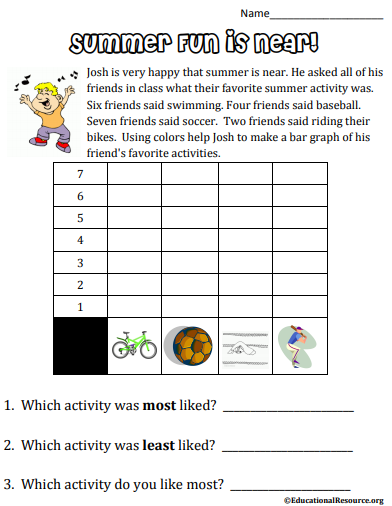
This is a two-page document. The first page tells a short story and students will graph the numbers in the story. Students will then answer three questions, two of which help them interpret the results. The second page is a movement activity in which students will first draw depictions of their four favorite summertime activities and then they will go around the classroom asking their classmates which one of the four they like best. They can use tally marks to keep track. Lastly, the students will create a bar graph of the results and then answer two questions analyzing their data.
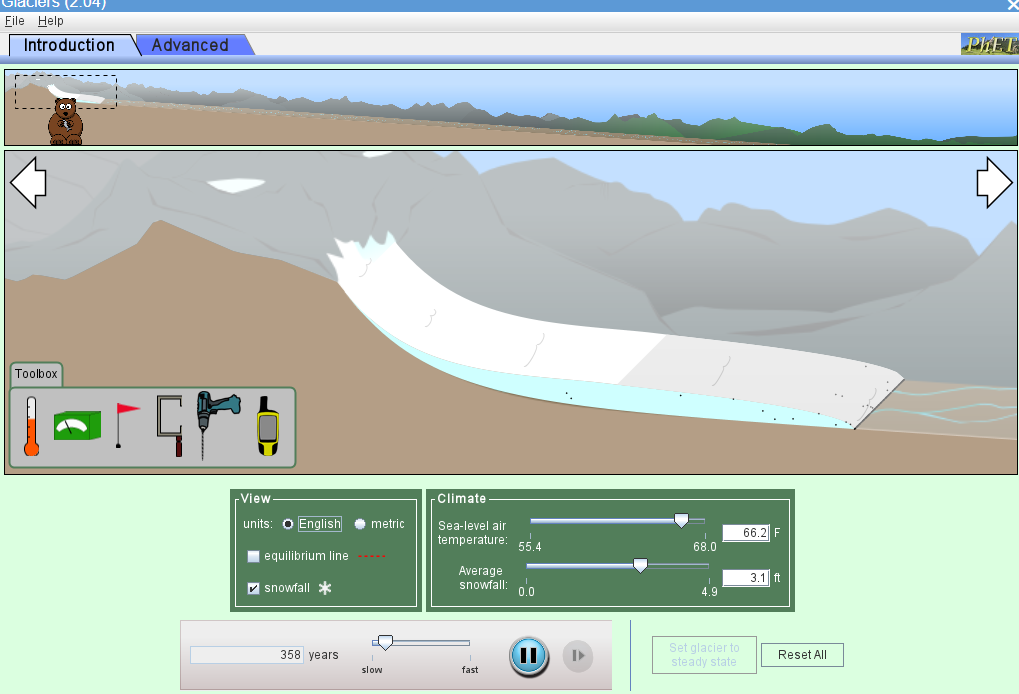
This is an interactive digital glacier lab that will help students understand what glaciers are, what some of the formations and deposits look like, and will have students explore how glaciers grow and shrink, and how scientists go about discovering glacial movement speeds over time as well as finding out how scientists come up with the numbers of how long glaciers will last at current rates. Students will actually be the scientist discovering the rate of speed as they build their own interactive glacier using Phet. You will need computers that can run Java.
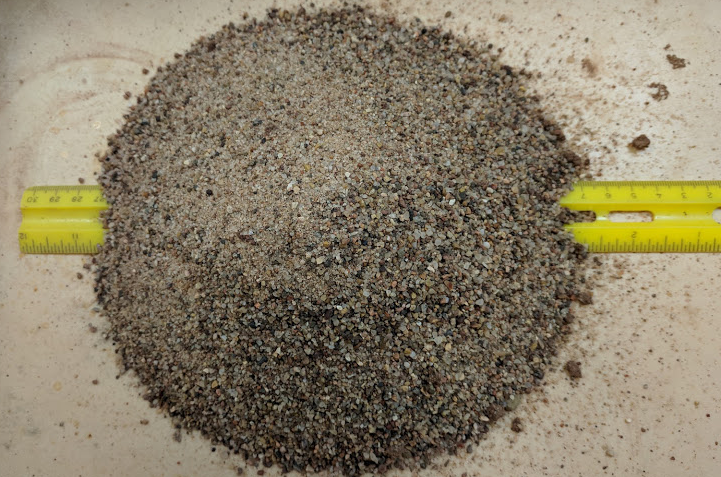
In this lab, students will take piles of sand and determine what the sand's angle of repose is. Students will compare 4 trials and see at how many degrees slope will the sand be able to handle before it has a landslide. There is math involved in this process. Students will then answer some questions based on their observations.
For more Earth Science labs and activities, visit EarthScience.xyz