Lab
The El Guapo Loco Science Show--Episode 4: Clouds
In this episode El Guapo and Mr. Weir visit Argentina and the Iguazu Falls. They then teach about waterfalls and clouds. Students will be taught how to make a cloud in a bottle. Spanish words they will learn are: Buenos Dias, El Rio, Gaucho, Qué Guay. Science words that students will learn are: Waterfall, resistant rock, water vapor, and condensation.
The El Guapo Loco Science Show--Episode 5: Sound in Peru
In this episode of the El Guapo Loco Science Show, Mr. Weir will show the kids what Machu Pichu is and some of the animal life that is found in Peru. A Peruvian dance will also be shown. El Guapo will teach students what sound is. The final science project will find students creating Pan flutes using nothing but Bic pens, erasers, and scissors. Students can make as fancy a flute as they want. Spanish words that are taught are Gracias, Si, and Qué Pasa.
Understanding Plate Tectonics Lab
Image
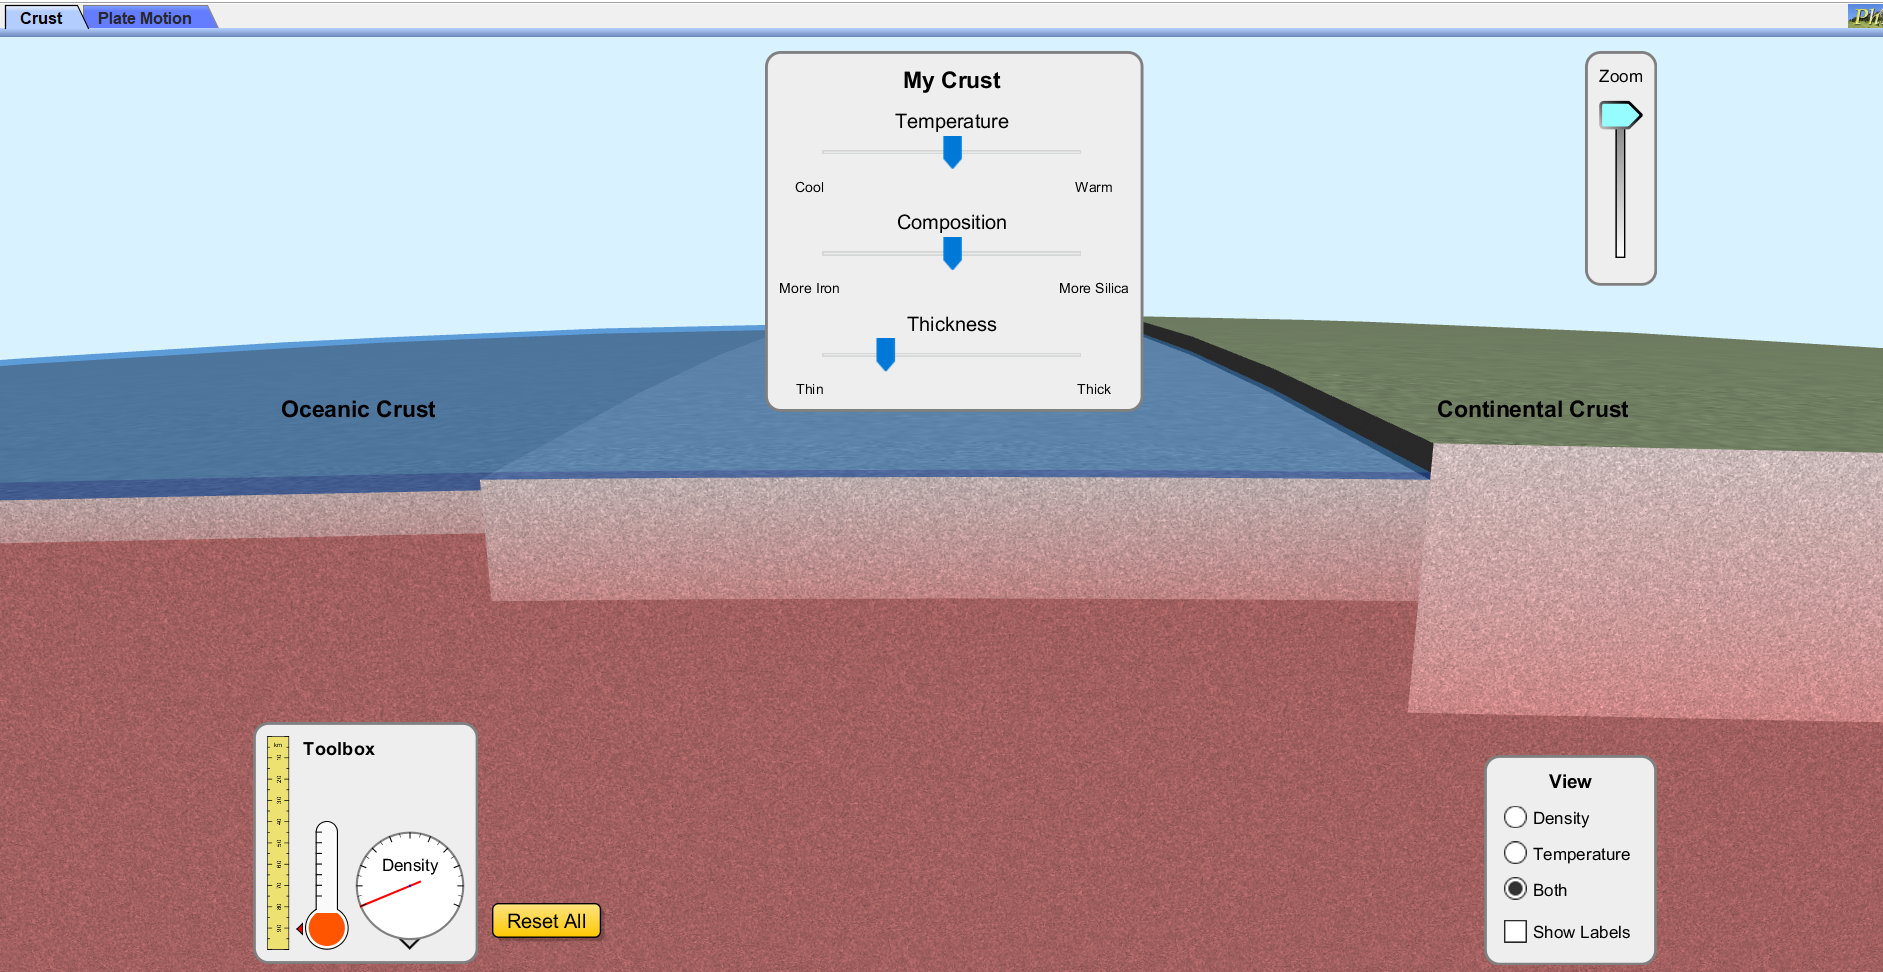
This lab will only work if you have Java on your computers. It should work fine on Windows machines.
Preview/Download
Relative Dating Lab for Earth Science
Image
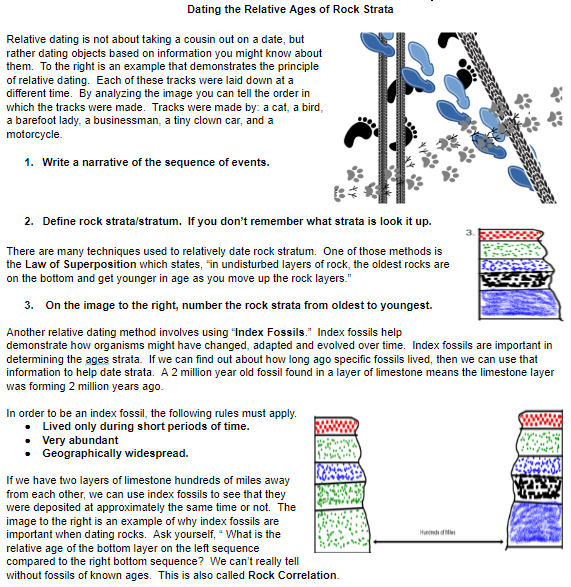
In this student self-guided Earth Science activity, students will read about and work their way through the different techniques used in Relative Dating.
Preview/Download
Understanding how to Interpret Weather Station Models
Image
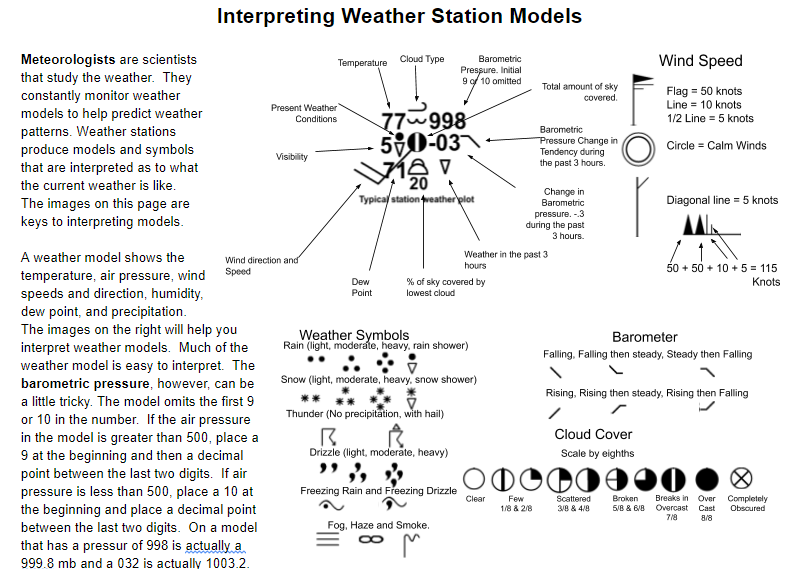
In this self-guided activity, students will gain an understanding of how to interpret basic to advanced weather station models. They will read barometric pressure examples and interpret whether the barometer is rising or dropping. Students will learn what many of the symbols on station models represent. Students will take real station model data from 2017 from around the country. They will have to interpret the temperature, dew point, wind speed in knots, wind direction, millibar pressure, change in MB, sky cover, visibility, and precipitation.
Preview/Download
Composition of the Atmosphere Lab for Earth Science
Image
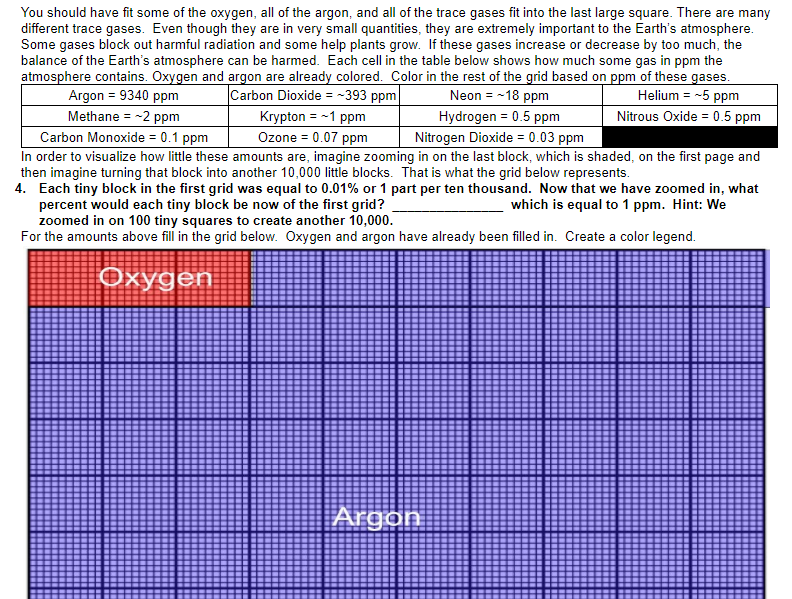
In this Earth Science activity, students will gain a better understanding of what gases the atmosphere is made out of. Students will need to work some math problems out, converting percents and decimal places to determine ppm, parts per million. Students will gain an understanding that greenhouse gases make up such a small amount of the atmosphere, but are extremely important in keeping the temperature balance in check.
Preview/Download
Earth Science Tornado Statistics Project
Image
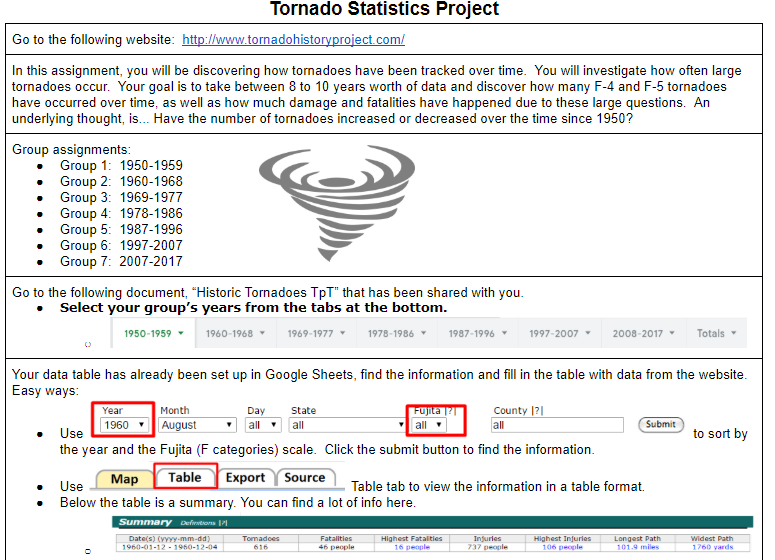
In this assignment, students will access a database with documented tornadoes since 1950. Students will use a Google spreadsheet as a class to gather data from the website. Data they will look into for each year are: Total tornadoes, Longest path, widest path, total F4s, total F4 fatalities, total F5s, total F5 fatalities, the month with the most tornadoes, and deadliest tornado sizes. When all data is collected there is a totals tab that contains three graphs that students can analyze. Students will also investigate and view states that have the most tornado events.
Preview/Download
Earth Science Fossil Identification Lab: Google Doc
Image
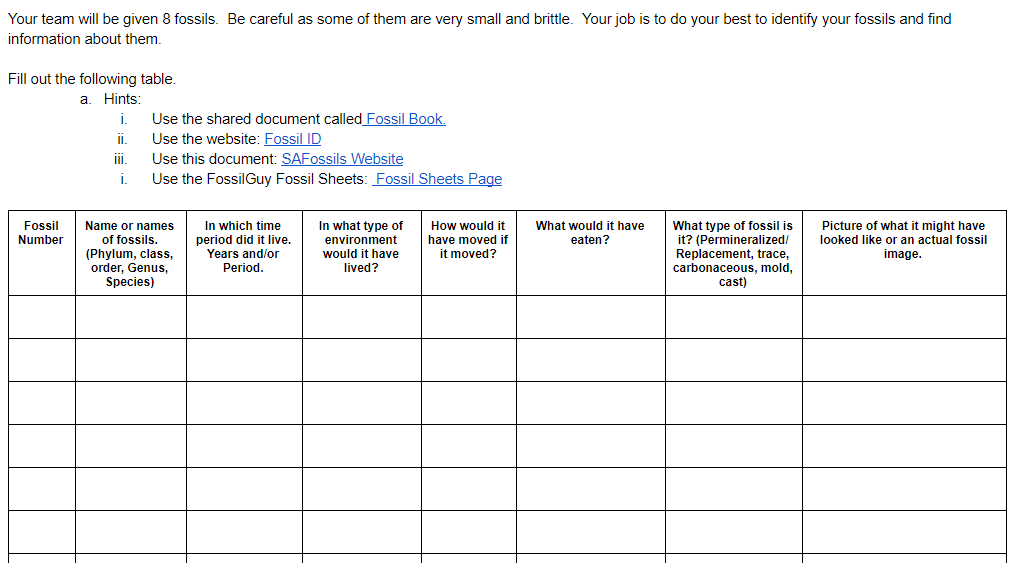
Note: You will need some fossil examples in order to complete this lab.
Preview/Download
Science Experiment Demonstrating the Scientific Method
Image
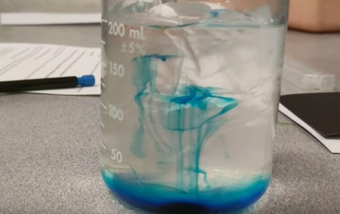
At the beginning of science courses, usually, the scientific method is taught. My high school students have to demonstrate their knowledge of the scientific processes and especially show understanding in data collection, variables, and conclusions. This document contains the rubric I use to grade their assignment as well as the student instructions that I give. This is in a Google doc so that you can edit the instructions or manipulate the rubric. You can see more and get earth science lessons and activities at http://EarthScience.xyz
